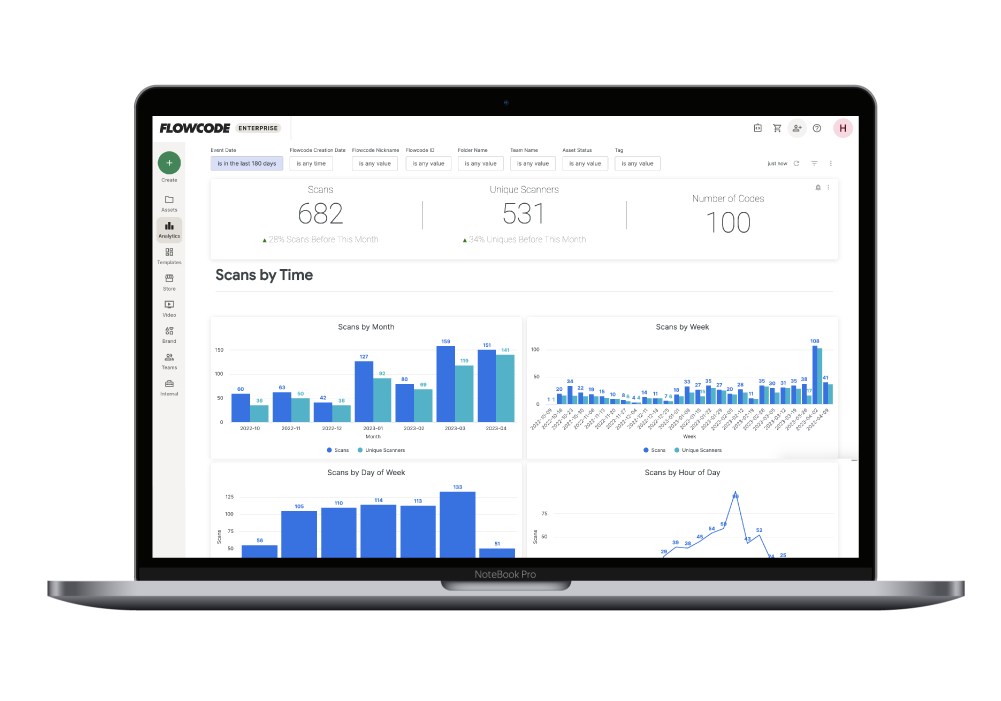
Access powerful conversion reporting. Flowcode is the only solution on the market that enables brands to see the full funnel analysis from offline media spend to online conversions.


Access the only tool in the world that lets you measure offline engagement. Within your Flowcode portal, customers can view a live and interactive geographic map that gathers demographic information from your scans, right down to the zip code level.

.png)

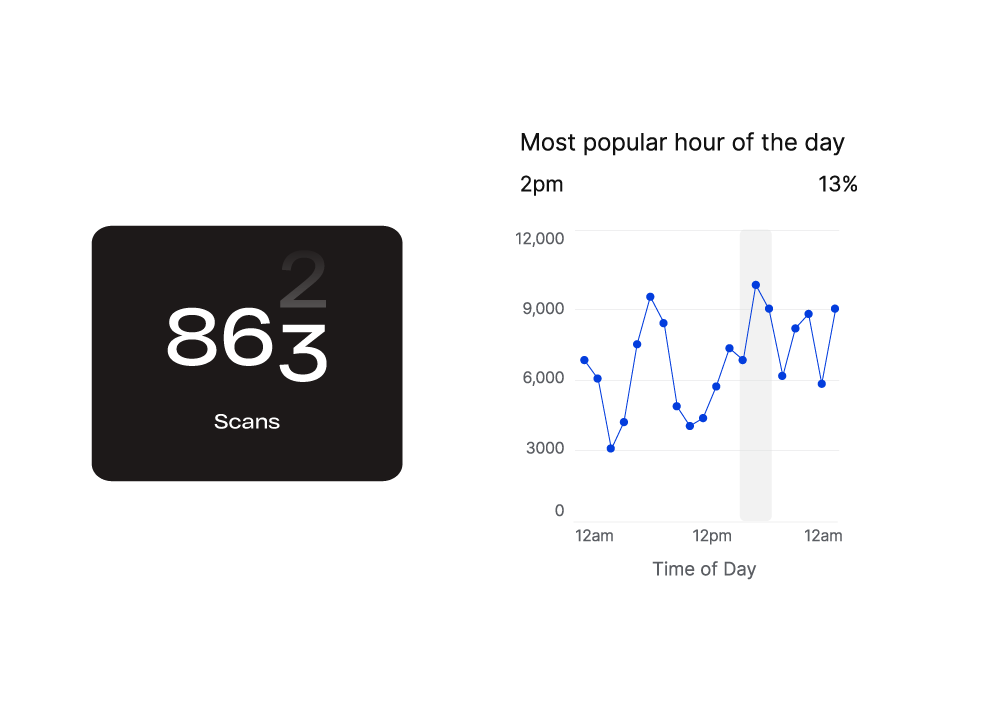
With some QR code providers you can get powerful analytics highlighting details of who is scanning codes. For example, with providers like Flowcode, you can see where your audience is scanning, total scans per day, device type, and more.
In order to track QR code analytics you’ll need to create a QR code with a platform that offers robust analytics. Flowcode’s analytics let you track details like total scans per day, location, device type, and more.
Yes! QR code generator platforms like Flowcode allow you to track details like how many times a QR code was scanned, where it was scanned, and more.
While you can’t see the exact person who scanned your QR code, you can see where it was scanned and how many times it was scanned. Platforms like Flowcode offer detailed analytics to help you make decisions about your QR codes.